#KnitPetiteProject: Some different sizing charts, and WHY they’re different

 Our last post asking if there should be an international sizing standard.
The #KnitPetiteProject plan.

All other #KnitPetiteProject posts.

Lend a hand to the #KnitPetiteProject and answer this brief survey!

We’re wrapping up March and the first section of the #KnitPetiteProject with a  comparison of some sizing charts. Now that we’ve looked in depth at the history of sizing and why we may encounter petite fit issues, we can take those numbers from our measurements taken in February and have a practical look at a few examples of sizing charts.

Let’s look at how to look at charts.

Decoding the Chart

You’ll find sizing charts in many places: the back of a changing room door, in an online retailer’s pop up window, maybe even on the clothing tag itself. Sadly, though, the information included on those tags and in those charts isn’t always super thorough. You may only get one or two measurements listed; you may have no idea what cross-back numbers they’re working from, or what the shape of their fit model may be.

But sometimes you can find more detailed information.

The rise of online shopping has motivated retailers to include more info for consumers; retailers don’t want you to return their product! So, they prep you with more detailed sizing charts than you might otherwise have encountered in a brick-and-mortar store.

One of the key questions to ask when you’re faced with these sizing charts is “what do these numbers mean?”

#1. Make sure you know that these numbers are either body measurements OR garment measurements

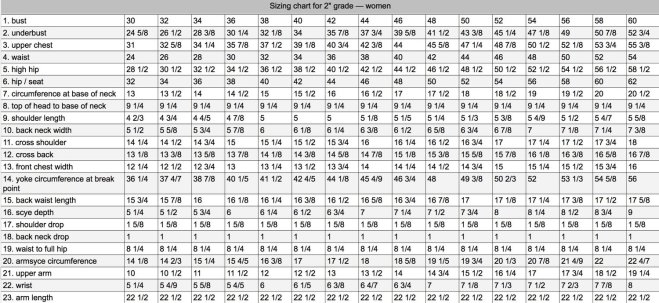
This makes quite a difference. The chart below from CYC (which many knitwear designers and publications1 rely on for their sizing) gives body measurement numbers.

cyc
CYC women’s sizing chart

You can tell this because when you visit the CYC website here, they actually have written in all caps, “THESE ARE ACTUAL BODY MEASUREMENTS FOR BABIES, CHILDREN, WOMEN, and MEN in both inches and centimeters.”

The body measurements vs garment measurements is very easy to mix up!

And if you’re interested, the CYC has also listed on this page a wee chart that has general guidelines about our NEXT important chart-decoding point.

#2. EASE

The CYC chart illustrated above is ACTUAL body measurements, but unless you’re a designer, you’ll likely encounter measurements listed on a pattern that are the garment’s finished measurements.

The reason there’s a difference is EASE.

Ease is the amount of extra (or less!) space designed into a garment for considerations such as the wearer’s comfort, style, function of the garment, etc. For example, a sock generally has to be snug to stay up on your leg, so because of this function, it’s usually a bit smaller than your actual foot measurements. This is negative ease.

Sometime style may dictate that a sweater be oversized. This means that the numbers listed for the finished sweater should be larger than your actual body measurements. This is positive ease.

For some visual examples of ease, you can read over my detailed post from 2012 here, that uses a single sweater design in a variety of eases on a variety of people.

Designers generally include notes about how much ease is designed into the sweater, and more recently, patterns have also begun to note the size of the photographed model vs the size of the sweater she’s modelling. This is extremely valuable information for YOU as the knitter to make a choice about how you want your garment to fit your body.

We’ll be having a more nuanced conversation about ease in the next 3 months; it’s a topic that a number of you pointed out as important in the first #KnitPetiteProject survey, and it’s a rich and significant topic when it comes to making informed decisions about how you want your clothes to fit YOU!

#3. Who is this Chart For?

Sizing charts, whether large or small, have any number of different intended audiences. Like we mentioned above, sometimes in-store retailers give consumers only a small amount of information on the tag, presuming you can easily go in to the change room and try it on.

Sometimes the information included is intended for designers; this usually means there’s a lot more info on the chart.

And sometimes you can find charts that have a more specific target than just “adult women”. Sometimes you can find detailed charts with information especially for petite women, plus-size women, tall women, older women, etc…

Examining Charts

For each of the charts we’ll look at below, have your numbers ready and ask yourself these questions:

  1. Who do I think this chart is for/who does it represent?
  2. What are the differences in my numbers and the chart numbers?
Knitwear Designer Charts

Now that you know the CYC chart above is actual body measurements, let’s take a look at what it tells us. The good thing about CYC is that it includes nine different points of measurement, and has a large size range for adult women. Significantly, it has some key length numbers such as armhole depth and back-waist length.

And of note, this chart is intended for knitwear designers, and is a popular source of information. If you encounter consistent fit issues in your knitted sweaters, it may be worthwhile taking note of the differences between your numbers and CYC’s numbers. We’ll be going in to more detail about this over the next 3 months.

Ysolda’s New Chart: As you probably already know, I’m pretty excited about Ysolda’s new chart.2 This is another sizing chart used by many knitwear designers, so looking at this and becoming familiar with its content is knowledge you can apply when you are selecting and/or modifying your next knitting pattern.

Take out your numbers again and have a peek at Ysolda’s charts. Any differences? How does it measure up against CYC for you?

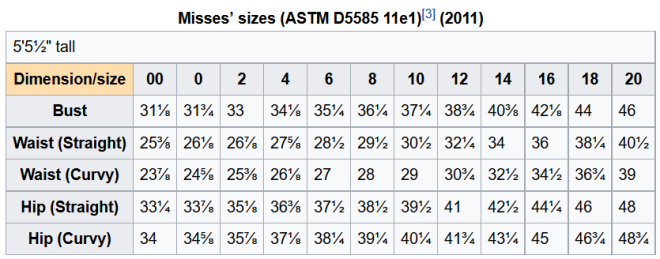
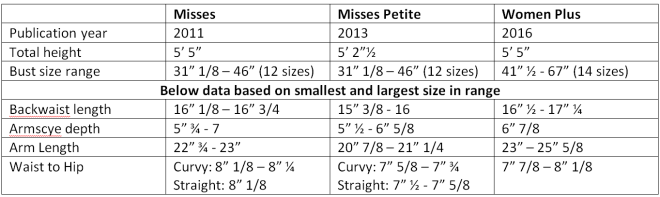
Ysolda takes sizing very seriously, and has included some important background information on how she created these charts. She says “[e]ssentially this is a compilation of sizing charts from a range of sources, including the ASTM standard charts for misses and plus-size women and several patternmaking manuals. It’s specifically intended for grading hand knitting patterns rather than sewn garments and follows knitting industry conventions …” (emphasis my own). She also makes it very clear that these are body measurements. Now, we know that Ysolda looked at some of the charts and background info we’ve looked at, including ASTM.

Ysolda goes on to talk a bit about CYC; “Many publications require designers to follow the sizing charts published by the Craft Yarn Council. These lack measurements and, I suspect, cause some confusion around shoulder widths and armhole depth. I’ve tried to make a chart that follows the sizes set up in that chart but with a wider range of measurements.” (emphasis my own)

Significant! Because Ysolda’s let us in on her thought process and research, we can see the differences and some motivation behind her charts, and perhaps find that those differences are significant enough for us to prefer one chart over the other.

And, if you read nothing else about Ysolda’s charts, I hope you check out what she has to say about LENGTHS:

“You’ll notice that some lengths are consistent across the size range. This is because the sizing chart is based on women of the same average height across the size range. Whether larger bust sizes should also be proportionally taller is a matter of some debate, and you may wish to make slight adjustments to these measurements.

The length of the underarm to neck area *will* increase between sizes, some designers handle this by reducing the sleeve and body lengths as the sizes increase.

Personally I prefer to keep sleeve and body lengths close to the same across the size range allowing knitters to make adjustments as required for height independent of bust size. The exception is for very close fitting garments where a little extra length is required to follow the curves of the body in larger sizes.”

So folks, as you see, while two of the most popular knitwear sizing charts don’t specifically include petite measurements Ysolda has at least addressed lengths, with guiding thoughts for the designer (and all of us, as knitters!)

One of the questions that came up in the first #KnitPetiteProject survey was:

Why do the designers think that if my bust is larger, my arms and shoulders have also grown immensely?

You can find at least part of the answer in Ysolda’s discussion on lengths.

Sewing Charts

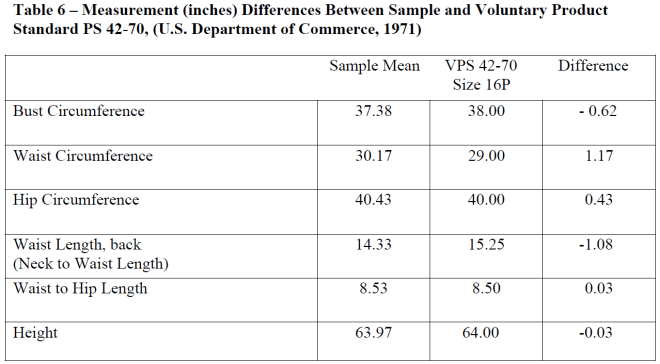
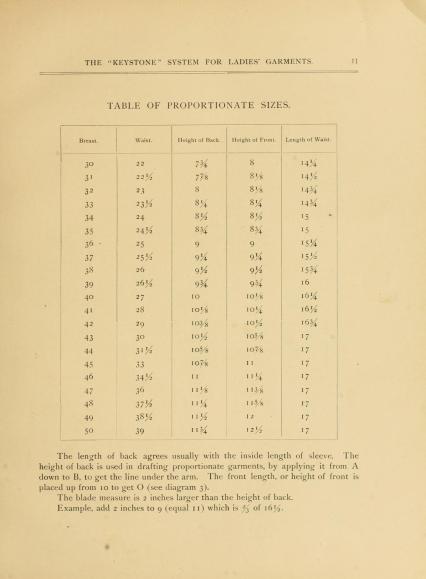
Let’s take a wee peek at some charts from history: vintage sewing charts that are based on those PS42-70 (PDF) standards we looked at a few weeks ago.

Those standards were readily embraced and applied by home sewing companies, but many large retailers eschewed them. And as we mentioned earlier this month, sewing companies themselves aren’t using all these charts any longer. You can’t find just petite sewing patterns from the big companies.

But hey, let’s take a look anyhow and see what we’d have been faced with in the 1970s.

The lovely retro sewing book I’ve taken these charts from is The Reader’s Digest Complete Guide to Sewing from 1978.

IMG_3746

Here you can see how, back in the 70s, sewing patterns were broken down into a greater variety of body types, including height and weight differences. As we’ve seen, ultimately these numbers are flawed and represent an out-dated, limited set of individuals.

Knowing this history is valuable for moving forward!

And, for some more recent sewing charts, below you can see Simplicity’s chart, (one of the Big Four sewing companies). This is taken from their free Sewing Pattern Fit Guide PDF

simplicity

And why is this chart the way it is?

Last year, Seamwork Magazine published a fantastic article about the history of clothing sizes. In it, the author interviewed the Design Development Director for Simplicity, Deborah Kreiling. She said, “Our patterns size standard measurements have been the same since the mid-1960s…In the mid-1980s the four big brands regrouped and felt that there was no need to reinvent pattern sizing. As long as we were still using the same standard body measurements to create the patterns, the sewing customer, at least, had something that remained true.”

So THESE numbers are the same, but why is it so difficult to find all those varied Junior, Junior Petite, Petite, etc sizes?

In their chapter on Sizing for the Home Sewing Industry, S. P. Ashdown, L. M. Lyman-Clarke, P. Palmer note that “…many of the categories that were experimented with in the past did not sell well enough to produce and have been eliminated. One such category is a miss petite size defined as approximately 5 feet 2 inches, and average bust, short in the torso (short waisted) and slightly larger than misses’ sizes in the waist.”3

And, just one more!

I haven’t found it easy to locate any good information out there about petite plus sizing. Pretty much the only source I did find was from Kathleen Cheetham of Petite Plus Patterns. Her patterns are designed, “…especially for the woman with narrow shoulders, D cup bra, rounded tummy…”.

petiteplus

Cheetham has stated outright the specialized group her charts are for. Do you fall into this group? Do you find these body measurements are closer to your own than some of the other charts we’ve seen so far?

Still hungry for more charts? I’ve collected a few on my #KnitPetiteProject Pinterest board.

Retailer’s Charts

Finally, let’s look at a couple of retailer’s charts.

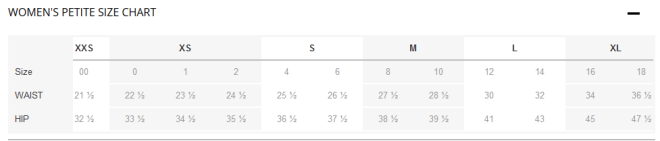
Old Navy has a full-on petite section on their website.

oldnavy

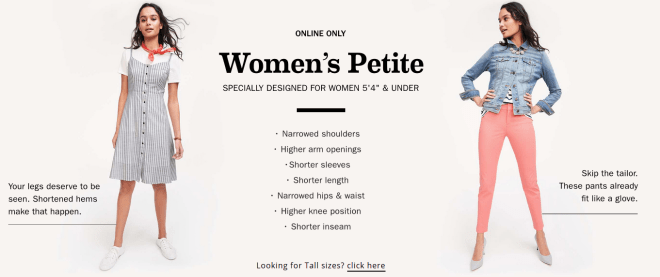
They’re working to convince you that they’ve taken petite proportions and numbers into account in their clothing. I personally have never bought Old Navy petite clothes, so can’t comment on how accurate a fit they may give. But below, YOU can see the charts Old Navy uses. Note, these appear to be charts with only limited info, and appear to be just for lower body measurements:

oldnavy

Another retailer we can take a peek at is Reitman’s. They have sections in their online shop for petites, and even “ultra petites”, but I’m sorry to say that their sizing charts are an example of some of the LEAST amount of information you as a consumer can get. See them for yourself here: petite and ultra petite. Disappointing, yes?!

This is particularly annoying, as I found a chart (likely old!) that included a petite plus section for Reitman’s – a size chart that’s not easy to find!

#KnitPetiteProject Wants to Know…

In May, we’re going to start looking at the nitty-gritty of different petite mods for knitwear. The first post of the month is going to give some real-life examples of knits that have been modified for petite bodies.

Want to help out? Please let me know your experience with making petite mods to your knits. What modification did you make? Which pattern did you choose? Are you happy with the results? Contact me by replying to this post, or email me at canaryknitsdesigns at gmail dot com.

Thanks for your help!

The Second #KnitPetiteProject Survey!

In February and March we’ve laid a foundation for WHY we may encounter petite fit issues. Stay tuned in April, when we’ll be looking in depth at what those petite fit issues are. I’ll be asking for YOUR HELP, and sharing the results of the survey at the end of the month.

Please lend a hand to the #KnitPetiteProject and answer this brief survey!

Question

Look at the sizing information available from your favourite store. Is it thorough? Is it close to your own measurements?

AND

Please share any petite and petite plus retailer’s charts!

Resources

1 Knitty is an example of a popular published that uses the CYC standards.

2 Ysolda’s old chart isn’t super easy to find online anymore, and I’m sure that’s intentional. She withdrew that chart a few years ago. If you’re curious about how her new chart differs from the old one, you can do a bit of internet searching and check it out.

3 S. P. Ashdown, L. M. Lyman-Clarke, P. Palmer. “Sizing for the home sewing industry” Sizing in clothing: developing effective sizing systems for ready-to-wear clothing. S. P. Ashdown, Textile Institute (Manchester, England) pg 340.
Woodhead Publishing in association with The Textile Institute, Apr 20, 2007.

Save

Save

Advertisement
#KnitPetiteProject: Some different sizing charts, and WHY they’re different

#KnitPetiteProject: Should there be a compulsory (inter)national sizing standard that companies must adhere to?

Our last post outlining how the standard for petite is different than the standard for misses/women.
The #KnitPetiteProject plan.

All other #KnitPetiteProject posts.

When I started the #KnitPetiteProject I was convinced that there should be a sizing standard adhered to across the board: from the perspective of a consumer, I thought this would make it so much easier for me to select items store-to-store, and at the very least I would know that all items would need alterations in all the same ways.

The more I read, the more I have become convinced that this is a very difficult, maybe impossible and undesirable goal.

Adopting a worldwide clothing sizing standard, especially for body size dimensions, is difficult if not impossible, given the wide variation in body dimensions and cultural diversity in shopping and product expectation.”1 emphasis my own

Sizing Standards are Voluntary

As we’ve seen over the past few weeks, the creation of sizing standards is a large, research-intense undertaking by governments or international standards bodies, whose findings are voluntary for manufacturers and retailers.

As a refresher, some standards-creating bodies currently are ISO and ASTM.

Smaller Population Target = Higher Accuracy of Fit

A research guide from Tufts notes a few important guidelines when it comes to working with anthropometric data:

  • Most data sets focus on particular populations, such as children, populations sharing a particular medical condition, or members of a profession, such as the military or an athletic sport.  These should not necessarily be extrapolated to general populations.

  • Apples must be compared with apples, not oranges.  When merging multiple data sets, make sure that they share common features such as units of measurements, the physical condition or age of the subjects measured, etc.  Pay attention to the terminology for specific measurements.

  • Chronology and geography is important.  Averages evolve over time due to migration, changes in diet, mortality, and other factors.  Data collected in a one country or region 50 years ago may not apply to a later population in a different location.

Even if a widespread, representative body scan project was implemented in the United States today, all the data collected would have to be revisited in a few years to ensure accuracy. It would also have to be narrowed into representative groups of individuals (in this case outlined as children, those with certain medical conditions, etc). Of course, this applies to the segment of adult females as well.

A researcher we’ve referenced earlier, K.L. Labat, states that “[t]he need for an international standards organization is not in developing a worldwide standard with a one-size-fits-all agenda, but to coordinate and make available body measurement data from all the countries wanting to participate in world trade of apparel.”2

Also noted from Labat is the desirability of defining sizing systems for specific target markets, gaining a better understanding of the differences and similarities of human bodies. I’d like to think we’re working toward that with the #KnitPetiteProject!

Variations between Nations + Ethnicities

To flesh out the idea of smaller target population, take a look at this info: Labat outlines a number of different countries and their work toward developing a sizing system. Check out the info below and how much it varies:

  • Germany (1983) published a system that identified 9 figure types using the height by hip as the key dimension.
  • Hungary (1986) created its system using height and body build with 3 key body measurements.
  • Korea (1990) used 5 height groups for its system.

Even within the same nation, there may be a variety of body type differences associated with ethnic backgrounds. The data we looked at last week from the CDC (pdf) gave us a bit of insight. This article from scholars C. L. Istook and S-J Hwang Shin argues the importance of understanding the shape of diverse ethnicities: “This study revealed that ethnic groups had different fit problems and significant body shape differences. Even within the same figure type category, a variety of body dimensions existed in each ethnic group.”

Size as Marketing

“…is it possible to satisfy all of the female population with a manageable number of standard sizes? Based on the conservative estimates expressed in our question above, a retail store would have to carry some 72 different sizes to cover the entire female population!3 emphasis my own

Susan Koger, co-founder and chief creative officer of ModCloth, wrote this op-ed for the Business of Fashion in April 2015. Through customer feedback and independent 3rd party surveys, ModCloth discovered that 88% of women size 16+ would buy more clothes if they came in larger sizes.  There was considerable work involved in order to serve this segment of ModCloth’s market: as Koger says, “…we set up a dedicated team to ensure fit and proportion are properly executed across all sizes, and shared this with designers that sell on ModCloth, as many lacked the resources to extend their sizing.” Ultimately, this was a very successful and valuable decision for the company.

Personally, I know I have made purchases through this website because of its brand-attitude toward body positivity – they appear to very much believe in this ethos, not only creating / supporting / selling clothing in larger sizes, but also including (un-photoshopped) images of larger sized models.

Size as marketing is powerful: this ModCloth example demonstrates how a company looked into their market, did their research, worked through all the follow-up steps, and delivered on their value statement, becoming attractive to customers because of this work, as well as the pure existence of the clothing sizes they sell.

If ModCloth had to stick to an (inter)nationally dictated sizing system, this work may not have been accomplished. The company was able to look internally and serve its market.

Companies and manufacturers with up-to-date anthropometric data can select out the numbers for their own target market and serve those individuals with a greater accuracy than, say, a company that relies on charts/data that represent an average woman from the total female population. Or, even more skewed, a set of data from a female population entirely apart from the one they wish to serve.

The lack of an enforced (inter)national sizing standard means that as consumers we may lose the ability to hop from shop to shop, knowing we’re always a size 12. But it also means that we may be able to find a shop for whom WE are the target, and have an even better fit experience, consistently, within that manufacturer.

Fun Fact

Perhaps this fact isn’t “fun” so much as interesting: according to the Youtube stylist Lauren Messiah, within the fashion industry “tolerance” allows the garment creator a margin of human error: it means they can mess up within 2 inches ie: cutting too much fabric from the pattern, machine skewing and messing up seam allowance, etc… You can pick up the same shirt/brand/style/size within the same store and they may not be the same at all!

“The number on the tag doesn’t determine your worth, and it’s not even true most of the time.”

Question

Have you ever purchased clothing (IRL or online) from a foreign country? Did you notice any differences in the sizing?

#KnitPetiteProject Wants to Know…

In May, we’re going to start looking at the nitty-gritty of different petite mods for knitwear. The first post of the month is going to give some real-life examples of knits that have been modified for petite bodies.

Want to help out? Please let me know your experience with making petite mods to your knits. What modification did you make? Which pattern did you choose? Are you happy with the results? Contact me by replying to this post, or email me at canaryknitsdesigns at gmail dot com.

Thanks for your help!

Resources

1 K. L. Labat, “Sizing Standardization”, Sizing in clothing: developing effective sizing systems for ready-to-wear clothing. S. P. Ashdown, Textile Institute (Manchester, England) Woodhead Publishing in association with The Textile Institute, Apr 20, 2007. pg 100.

2 Ibid, pg 102.

3 Marie‐Eve Faust, Serge Carrier, Pierre Baptist, (2006) “Variations in Canadian women’s ready‐to‐wear standard sizes“, Journal of Fashion Marketing and Management: An International Journal, Vol. 10 Iss: 1, pg 80.

#KnitPetiteProject: Should there be a compulsory (inter)national sizing standard that companies must adhere to?

#KnitPetiteProject: How is the standard for petite different than the standard misses/women?

Our last post outlining how we arrived at the standard we have today.
The #KnitPetiteProject plan.

All other #KnitPetiteProject posts.

In anticipation of the standardized chart comparing we’ll be doing at the end of the month, this post will look at some of the differences that exist in the ASTM size charts for Misses and Misses Petite.

ASTM: Comparing Misses’, Misses Petite, and Women’s Plus

astm1
Wikipedia article

The ASTM sizing standards are a good place to start when comparing sizing differences: while they are indeed voluntary for the apparel industry, they are influential, regularly updated, created through various expertise sub-committees, and relatively inexpensive for individuals to obtain (charts cost around $45). I know these charts are used by some designers within the knitwear industry; Ysolda’s newly updated chart cites ASTM data as one of several sources.

As the full charts are behind a paywall, I’m only sharing the above information from Wikipedia and a few comparison points below. This will give you a general idea of the area of difference within ASTM as an influential organization’s suggested standard.

To clarify: as I know I certainly get these numerically-referred to charts confused: the Misses’ Chart is ASTM D5585, the Misses’ Petite is ASTM D7878, and the Misses’ Plus is ASTM D6960. I must apologize, as I don’t currently have a copy of the Women’s 55 years and older chart ASTM D5586; I hope to get that one soon and be able to include it in comparison in the future.

chart

A few things to note about this chart:

ASTM develops these tables from a variety of data sources including: the U.S. Department of Commerce, the Caesar study, SizeUSA, current U.S. industry standards, and studies, scans and documentation from Alvanon Inc. They have also included variations in size for curvy and straight body shapes, as you see above.

These charts leave out an upper size range in the petites, cutting them off at a 46″ bust. They also increase the backwaist length through all three charts (even though they take as standard a particular total height). The backwaist length at its shortest in petite is 15″ 3/8; the same bust size in regular misses is 16″ 1/8 and the smallest plus size has a backwaist length of 16″ 1/2.

An important take away: check the garment schematics for your knitting patterns. Good patterns will have good schematics with many different measurements included. Something important to look for is that total body length / sleeve depth / bottom of sleeve to bottom hem.

It’s also important to note that these charts we’re looking at today are body measurement charts, and that knitting schematics are (supposed to be) measurements of the finished knit, NOT the body. Designers have taken into account ease of various kinds and amounts depending on the style and body part being covered. Confusing, I know! But if you peek forward in the #KnitPetiteProject Plan, you’ll see I’m hoping we can have a KAL later this year where we can all work together and help each other understand our own petite needs.

SizeUSA

The study we looked at in previous weeks compared the regular and petite sizing from SizeUSA:

The petite group showed significantly lower mean values than the regular group for all the vertical measurements. The petite group had a 3.7″ shorter stature, 2.16″ lower crotch height, and 1.26″ lower knee height on average than the regular size group…. The petite group also had significantly shorter lengths than the regular group by 0.14″ at shoulder length, 0.82″ at the back waist, and 1.52″ shorter for arm length. pg 55

Interestingly, this study also found significant differences in the SizeUSA data between the widths of regular and petite women. We might guess this is obvious if we think about the way we culturally use the word petite. But something that may NOT be obvious is the numbers show that petite women had a smaller drop value between waist and hip than the regular group (that is, the difference between waist to hip, or bust to waist).

As a reminder, this is the study we looked at that outlined different ways you can be petite, from top petite, bottom petite, average petite, and plus petite. It might make more sense now that I remind you the ASTM charts, according to this study, most closely matches the measurements for top petite.

You Should Read This

As the #KnitPetiteProject progresses, I keep reading! I’ve already come across (new to me) sources filled with info that anyone can access, and are topics that have already been addressed in previous weeks’ posts.

I figured, instead of going back and editing those old posts, I’d start a new section wherein I’ll alert everyone to some cool reading material you can easily access and learn from.

This week is the first!

As mentioned a couple of weeks back, there is nearly no research done and applied from petite anthropometry data, and that data is what is needed to form an accurate and appropriate sizing standard. Some of the papers that do exist on the topic are from graduate level students. One such is an exploratory study by Lisa Barona McRoberts for the Louisiana State University titled “Petite Women: Fit and Body Shape Analysis“. In her opening abstract, she states that”[f]igure type analysis of the sample indicated that most subjects were outside the industry silhouette definitions. None had the industry standard hourglass figure.” (pg vii). I’d recommend you read over her paper: it’s written in a very accessible way, and is filled with great information like a review of the literature to date.

Fun Facts from her paper

  • 47% of the women in the United States between the ages of 20 – 49 are petite.
  • SizeUSA was created by TC2 primarily to create a new sizing standard for ASTM and private clients (thus restricting the disclosure of the data and results, ie: I can’t share all the data with you!)
  • “Despite the large percentage of petite women between the ages of 20 – 49 in the US, the sector has been largely overlooked. With the Latino and Asian population increasing throughout the country smaller sizes are needed”. (pg 17)
  • As a side note: SUPER interesting data from the CDC (PDF): they have charts filled with anthropometric data that show percentiles for all  measurements and separates out data from individuals from different races. They oversampled individuals “60 and over, all Hispanics persons, black persons, and those with low income to improve the precision of the statistical estimates for these groups.”  (pg 1)
  • According to the Standardized Pattern Measurement Chart for Women by Brackelsberg and Marshall from 1994, Misses’ petite sizes are 3/4 – 1 inch shorter between the back neck and waistline and 1/2 – 1 inch shorter between the waistline and the hipline than the measurements provided by the misses’ patterns. (pg 25)
  • The study conducted for McRoberts’ paper consisted of 52 petite women, 5’4″ and under, ages 20 – 49, taken from a metropolitan centre in the southeastern USA. They took a variety of measurements.
chart
from McRoberts paper, pg 30


The above chart is simply the data from that PS 42-70 standardization chart we talked about last week. The chart below is a comparison of the data from McRoberts’ study and the petite data from PS 42-70:

chart
from McRoberts paper, pg 45

Check that out: they found that the voluntary product standard and sample mean numbers showed significant differences in back neck to waist length. And, as McRoberts states, the back waist measurement is one of the most important measurements!

Fun Fact

Why is it so hard to find petite sizing in modern sewing patterns? According to S. P. Ashdown et al in their paper “Sizing for the home sewing industry”, comparing a misses regular size 14 and misses petite size 14 shows relatively minor measurement differences, so pattern making companies generally do not make petite patterns today. Note: this is information from sewing charts, which is taken from all that old data! Let’s hope computer assisted design and body scan technology help to update this, so the idea of petite bodies can have a greater place in our craft industry!

Question

Do you sew? Did you notice the lack of petite-specific designs today? Do you think separate, petite sizing should be reinstated based on new data?

Resources
#KnitPetiteProject: How is the standard for petite different than the standard misses/women?

#KnitPetiteProject: How did we arrive at the sizing we have today?

Our last post outlining how to take some important measurements and different ways to be petite.
The #KnitPetiteProject plan.

All other #KnitPetiteProject posts.

Buckle in folks, this is a history-heavy post!

While reading more and more about the history of sizing standards I’ve personally noticed a couple things happening to my attitude towards clothing and sizing standards:

  1. These standards are not something stemming from time immemorial. They have a relatively short history, which makes dismantling them a more approachable undertaking.
  2. My sympathy towards clothing manufacturers has grown. Trying to serve populations with clothing that delivers a satisfying fit is tremendously complicated.

I’m sharing this information with you today, so that you too will feel even more prepared to dismantle (figuratively and literally!) clothing and sizing standards to suit your own tastes.

Since the time of the industrial revolution and the first widespread introduction of mass-produced clothing the apparel industry has struggled with the inherent contradictions of providing well-fitted clothing within the constraints of economical and practical sizing systems for the variety of people in a population. People vary along many dimensions, resulting in a multitude of sizes, proportions and postures to be accommodated…The complexity of sizing for clothing is unmatched by any other consumer product.1 (emphasis my own)

How Standardized Sizing Began: the 1800s

The interest in stable units of measurement stretches back to the Middle Ages. If you’re as nerdy about this as I am, you can find all sorts of interesting info about the vast array of length measurements dotting maps from the Age of Exploration onward for centuries.

That said, in order to produce a system of standards for clothing you need more than just stable units of measurement.2

Prior to the 1800s there isn’t much evidence of systematized measurements being applied to drafted patterns. This changed through several forces near the beginning of that century including industrialization and war. In particular, the Napoleonic Wars brought great need for clothing en masse, and demonstrated that the grading that existed was insufficient. Crude and simple tactics to create grades can be seen in the 1820s; European tailors appear to have been the first to base their measurements on anatomical information and relate that to proportion and pattern drafting.

As far back as 1826 there is evidence from the French tailor Michel Bailley that the breast measurement was the most significant number  upon which many proportional drafts were based.

In the 1840s, mathematical interest in averages were applied to clothing through the work of the Aldolphe Quetelet.3 He took tools used in astronomy and applied them to people, first using data from soldiers to determine their “true” chest size. By the  end of the 1800s, dressmakers’ manuals included tables of standard measurements that were proportional, and examples in sizes that (much like today!) were based on the bust size.

hecklinger
Hecklinger, chart of proportional sizes, 1891.

The fashion of the mid-late 1800s played a role in the need and desire for more exact sizing standards. Womenswear was quite close fitting and based on the changing shapes of corsetry. Dressmakers needed a system that was simpler and more efficient than the complex system that existed in order to produce clothing for their customers.

Charles Hecklinger in 1891 created the first systematic method of block adaption for women’s clothing. Looking at charts like this shows us the mathematical attempts at sizing simplification and standardization, and particularly show us the idea that circumference was thought to be tied to vertical measurements.

By the end of the 1800s, the mass production of women’s clothing in America was greater than the output from dressmakers. This is important to note because it was in America that the first major standardization studies were created only a few decades later.

In Europe this process developed more slowly, with small workshops and independent dressmakers using tailors’ techniques, giving them the ability to deliver personal service and close-fitting, fashionable garments.

The 20th Century

The fashions of the early 20th century played a part in the standardization of sizing. The old, distorted shapes created through corsetry were discarded, and a move toward looser, more flowing lines was embraced. This meant you were less likely to need such precise fitting for those “flapper” fashions; the attitude toward buying mass-produced clothing changed as well.

Those averages we referred to earlier from Adolphe Quetelet were again utilized for WWI; in WWII, however, it was discovered that those averages actually ended up serving no one perfectly rather than everyone sufficiently, and as we see today, the ideas of customization/adjustment were built into things like pilot’s seats in planes.

It was in this zeitgeist that the first large-scale collection of anthropometric measurements from women was undertaken from 1939-1941 by R. O’Brien and W.C. Shelton, supervised by the United States Bureau of Home Economics. This study is immensely important because it became the model upon which measurement data was collected throughout the world, and these numbers have greatly influenced sizing standards to this day. We should note that this was undertaken by the government, and that the adoption of its findings were voluntary.

While in theory we might think this study is a great basis of information for the clothing industry, there’s a few factors we should take into account.

Many clothing manufacturers and retailers aren’t keen on utilizing information of this sort. The data collected in the O’Brien + Shelton survey was limited to 10,042 women, all of whom were white Americans, aged 18 – 30 years old.4 Restricting the data collected to this population results in a misrepresentation of information; the importance of attention paid to a variety of body shapes associated with different ethnicities is erased. This data was intended to be a recommendation for the representation of all American women, and ended up representing a very narrow field of them.

The era of the survey also reflects a skewing of data; you can see this skew through the desire to update O’Brien + Shelton’s work in the publication of Voluntary Product Standard PS 42-70 (pdf here). One of the reasons there was a revisit of this data was a push from the Mail Order Association of America. After the association implemented the 1958 standard created from O’Brien + Shelton’s data, it found that this standard did nothing to reduce returns from customers due to poor fit.

The MOAA saw the then 20 year old information as unrepresentative of contemporary female body proportions. By the 1960s, data from health surveys showed that women were taller and heavier than they were in the time of Shelton + O’Brien; that said, the PS 42-70 revision was more a shift in size designation rather than a full undertaking of new data collection.5 Which of course means that changes were limited and accuracy was not particularly increased.

ASTM

Throughout the second half of the 20th century there was much work done in countries around the world to develop standards, all voluntary, and many undertaken by non-governing bodies.

ASTM International (American Society for Testing and Materials) was formed in 1898 and is one of the largest voluntary standards development systems in the world.6 ASTM is the group that administers the standard today, and it’s believed to be the basis for womenswear made by US companies today.

It’s “believed to be” because clothing manufacturers and retailers have their own, defined target markets, and want to serve those markets by developing sizing standards which create consistency within their store to build trust and brand loyalty. This is why you may enjoy the fit of a size X in one store, but find that the same size X in another store doesn’t fit at all. Companies develop their own standards through their choice of professional fit models who reflect the target market, related banks of information (eg: automotive industry), sizing charts from competitors, and their own data collection surveys.7 These differing standards can be understood fundamentally as a marketing tool.

Attempting to serve all American (Canadian, UK, Australian, etc…) women is a nearly impossible task – just imagine all the different factors of human body shape that would have to be taken into account for such a system to function. Dividing the population into smaller groups based on differing factors helps make this task more manageable. For example, ASTM administers a Standard Table of Body Measurements for women who are 55+ years old. This standard, ASTM D5586, shows differences in measurement from the PS 42-70 data, many of which were related to posture, body carriage, height, weight, and change in the shape of flesh and muscle as women age.8

This 2016 article (PDF) from the Journal of Textile and Apparel Technology and Management shows the continued importance of ASTM’s standards by using it as a comparison point against which data from SizeUSA is measured. The study compares regular sizes rather than petites, but is valuable to us in highlighting how the prevailing sizing system, even for regular sizes, is not reflective of the measurements of the population.

Developing a New Standard

ASTM developed the data for D5585 in 2011 not through a new anthropometric study, but instead by comparing apparel company and military anthropometric information. This feels frustrating to those of us on the receiving end of the information, though it’s important to note the difficulties in undertaking a brand new data collection survey. It’s expensive; it requires trained individuals to do the measuring (and/or expensive 3D body scan technology); the survey itself must be carefully designed to reflect a variety of peoples and shapes across ethnicity/geography/age and other factors; volunteers must be gathered; and a method must be developed to analyze the collected data.

When looking at the data to create standards, you can group the information based on the average (giving a reasonable fit for the majority near the middle of the distribution, eg: one size fits all garments like t-shirts, socks, tights), a range (which accommodates a larger percentage of the population which is where most ready-to-wear sizes are developed), or extremes (where very small or large sizes would be served, eg: petites, plus, etc).9

A particular population and their key dimensions have to be chosen to give structure to a sizing system, and then used to help predict other measurements, create size intervals, and distinguish body shapes. One hope for the future is the new technology of 3D body scanning.

Body Scanning Technology

This new technology is very exciting for academics in the field of apparel study. It can serve many functions, including offering new ways of analyzing body shapes, solving problems in sizing of apparel, evaluating the fit of garments, and eliminating the need for size charts and grade rules.10 On this website from Cornell University, you can see a comparison between a traditional fit-model based system of sized garments and the possibilities opened by body scanning for mass customization.

Countries that have undertaken studies using 3D scanning technology include Japan, the Netherlands, UK, USA, China, South Africa, Mexico and France.11

“Why do the designers think that if my bust is larger, my arms and shoulders have also grown immensely?”

This is a question asked in the first #KnitPetiteProject survey, and one that is perfect to address right here.

As you can see in the text above, systems of sizing standards have to take something as a key defining measurements. For Shelton + O’Brien in the 1930s, their recommendations were based on a correlation between weight, height, bust, waist, and hips. Because their findings were applied and mildly altered throughout the rest of the 20th century, they were wide-ranging and influential. That standardization requested by the MOAA in the 1950s (CS215-58) created a cascade of other countries developing such systems for themselves; a great example is the report published in Canada, using exactly the data from the United States.12

Anthropometric studies generally show that horizontal body measurements (girths) correlate well to each other, that vertical measurements (lengths) correlate well to each other, but that horizontal and vertical measurements do not correlate well.13

The ideas of correlation between those numbers of bust and shoulders traces back to that original Shelton + O’Brien (flawed, limited) data; of course, depending on where you got the garment, it may be a combination of that manufacturer’s own collected data, fit model, and target market.

Also of note is the petite fit paper we discussed last week, and that it states no study has analyzed petite size women’s body proportions and figure types using the recent and larger amount of anthropometric data currently available.14 Since we’re relying on that old data (unless/until 3D scanning technology builds a thorough database and academics sort through, make recommendations, and retailers apply that data), we’re all stuck in a place where the existing system, flawed as it is, presents itself as the overarching source of information.

As far as knitwear design goes, designers have to rely on some sort of standards to create their size ranges. As I alluded to in last week’s post, many knitting publications ask you to use the CYC standards, which include a relatively wide range of information, though it is limited in height data and has been found by some to be lacking in accuracy, particularly in the larger sizes.

Ysolda_sizing_chart_-_women_-_Google_Sheets
Ysolda’s sizing chart, Feb 2017.

A great example of how a variety of sources can combine in the creation of a sizing table is Ysolda’s new chart. For this new chart she lists the ASTM charts for misses and plus, as well as information from patternmaking manuals. She also notes, importantly, that these are body measurements intended specifically for knitwear (rather than, say, sewing). Ysolda’s chart is another popular option for sizing charts among knitwear designers, though, like the CYC, doesn’t separate out information for petite measurements.

All of this is to say that it’s very likely (especially if you’re in North America) that the clothing you’re wearing or designs you’ve made can trace their sizing back to that O’Brien + Shelton data, the CS215-58 standard, the PS 42-70 charts, ASTM’s standards, and any such charts with influence from these sources, and until there’s a significant revision of these standards with new data, then this is the information we all have to work from.

Fun Fact

Shelton + O’Brien believed it was necessary to consider stature along with the other circumference measurements; they chose to base their numbers on circumferences such as bust and the key dimension of the “standard” size of 64″ (5’4″, 162.5 cm).

Question

Are there any stores you shop in mainly because you prefer the fit of the clothes?

Resources

1 S. Ashdown, Preface to Sizing in clothing: developing effective sizing systems for ready-to-wear clothing. S. P. Ashdown, Textile Institute (Manchester, England) Woodhead Publishing in association with The Textile Institute, Apr 20, 2007. pg xvii.

2 W. Aldrich, “History of Sizing Systems and Ready-to-Wear garments”, Sizing in clothing: developing effective sizing systems for ready-to-wear clothing. S. P. Ashdown, Textile Institute (Manchester, England) Woodhead Publishing in association with The Textile Institute, Apr 20, 2007. pg 2.

The rest of this section is drawn from this chapter, which is pages 1 – 56.

3 99% Invisible podcast.”On Average“. Episode 226, August 23, 2016. accessed March 6, 2017.

4 Marie‐Eve Faust, Serge Carrier, Pierre Baptist, (2006) “Variations in Canadian women’s ready‐to‐wear standard sizes“, Journal of Fashion Marketing and Management: An International Journal, Vol. 10 Iss: 1, pg 72.

5 K. L. Labat, “Sizing Standardization”, Sizing in clothing: developing effective sizing systems for ready-to-wear clothing. S. P. Ashdown, Textile Institute (Manchester, England) Woodhead Publishing in association with The Textile Institute, Apr 20, 2007. pg 95.

6 Ibid, pg 92.

7 J. Bougourd, “Sizing Systems,fit models and target markets”, Sizing in clothing: developing effective sizing systems for ready-to-wear clothing. S. P. Ashdown, Textile Institute (Manchester, England) Woodhead Publishing in association with The Textile Institute, Apr 20, 2007. pg 118.

8 K. L. Labat, “Sizing Standardization”, Sizing in clothing: developing effective sizing systems for ready-to-wear clothing. S. P. Ashdown, Textile Institute (Manchester, England) Woodhead Publishing in association with The Textile Institute, Apr 20, 2007. pg 96.

9 J. Bougourd, “Sizing Systems,fit models and target markets”, Sizing in clothing: developing effective sizing systems for ready-to-wear clothing. S. P. Ashdown, Textile Institute (Manchester, England) Woodhead Publishing in association with The Textile Institute, Apr 20, 2007. pg 119.

10 Ibid, pg 146.

11 Ibid, pg 122.

12 M. -E. Faust, “Apparel size designation and labelling”, Anthropometry, Apparel Sizing and Design. edited by Deepti Gupta, Norsaadah Zakaria. Feb 15, 2014. pg 261.

13 A. Petrova, “Creating Sizing Systems”, Sizing in clothing: developing effective sizing systems for ready-to-wear clothing. S. P. Ashdown, Textile Institute (Manchester, England) Woodhead Publishing in association with The Textile Institute, Apr 20, 2007. pg 67.

14 Youngsook Kim , Hwa Kyung Song , Susan P. Ashdown , (2016) “Women’s petite and regular body measurements compared to current retail sizing conventions“, International Journal of Clothing Science and Technology, Vol. 28 Iss: 1, pg 49 – 50.

#KnitPetiteProject: How did we arrive at the sizing we have today?